


This update will elaborate on pre-Production load testing, and post-Production performance monitoring. Both use cases employ the Orbs monitoring dashboard as a key component.
In the weeks leading up to our planned launch, we were running stability tests on various network configurations. Our purpose was twofold: identify bugs that manifest themselves only after a long time the system has been online, and test the load limits of the system.
We wanted to share the progress of stability tests with the whole team, so we decided to create a Dashboard that would be posted on a TV at the office, where everyone can see real-time metrics of the running tests.
The requirement was to let everyone have a casual glance once in a while and immediately spot anomalies. Digging deeper into problems is left to other tools.
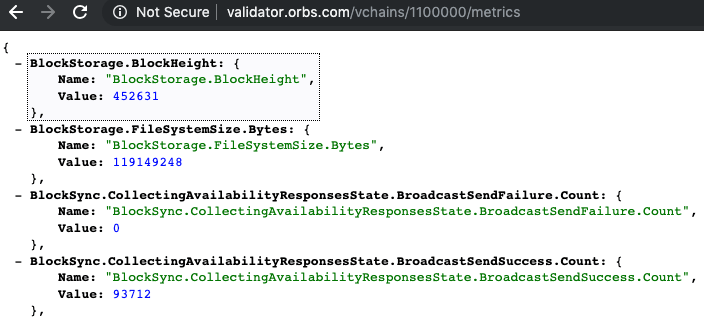
As a starting point, we already had a /metrics endpoint on the Orbs node, that prints out the node's metrics in JSON format. For example, see the Orbs Audit node metrics.
Below, you can see sample metrics on our validator node in Production - It shows the current block height as 452631:


···
For the presentation layer, we checked several dashboard solutions: Geckoboard is a great looking dashboard especially on a TV screen and if your use case is covered by what it supports out of the box, it is highly recommended. In our case we needed some features which were not available, such as displaying a time frame of less than 1 day, and the ability to perform calculations over the data directly in the dashboard.
Another solution we tried is DataDog, which showed initial promise as it supports scraping JSON metrics directly from a URL, and performing calculations over it. However we were not satisfied with the visual quality when displayed on a TV screen (specifically the lack of a Dark Mode), and decided to keep looking.
Eventually, we decided to use the Standard Plan of Grafana Cloud with a Prometheus backend for these reasons:
Grafana is a presentation layer only, and can receive data from multiple data sources, in our case it was either from Prometheus or Graphite - both of which are industry standards for a Time Series Database (TSDB). Since Prometheus has client libraries for both Go and Javascript we went along with it.
As for the actually displaying data, we started with a TV monitor attached to an off the shelf Android TV device, but it turned out that several browsers we tested on the Android TV did not render correctly any of our tested dashboards, and it was not possible to disable the screen saver and have it load the dashboard on startup without hacking the device.
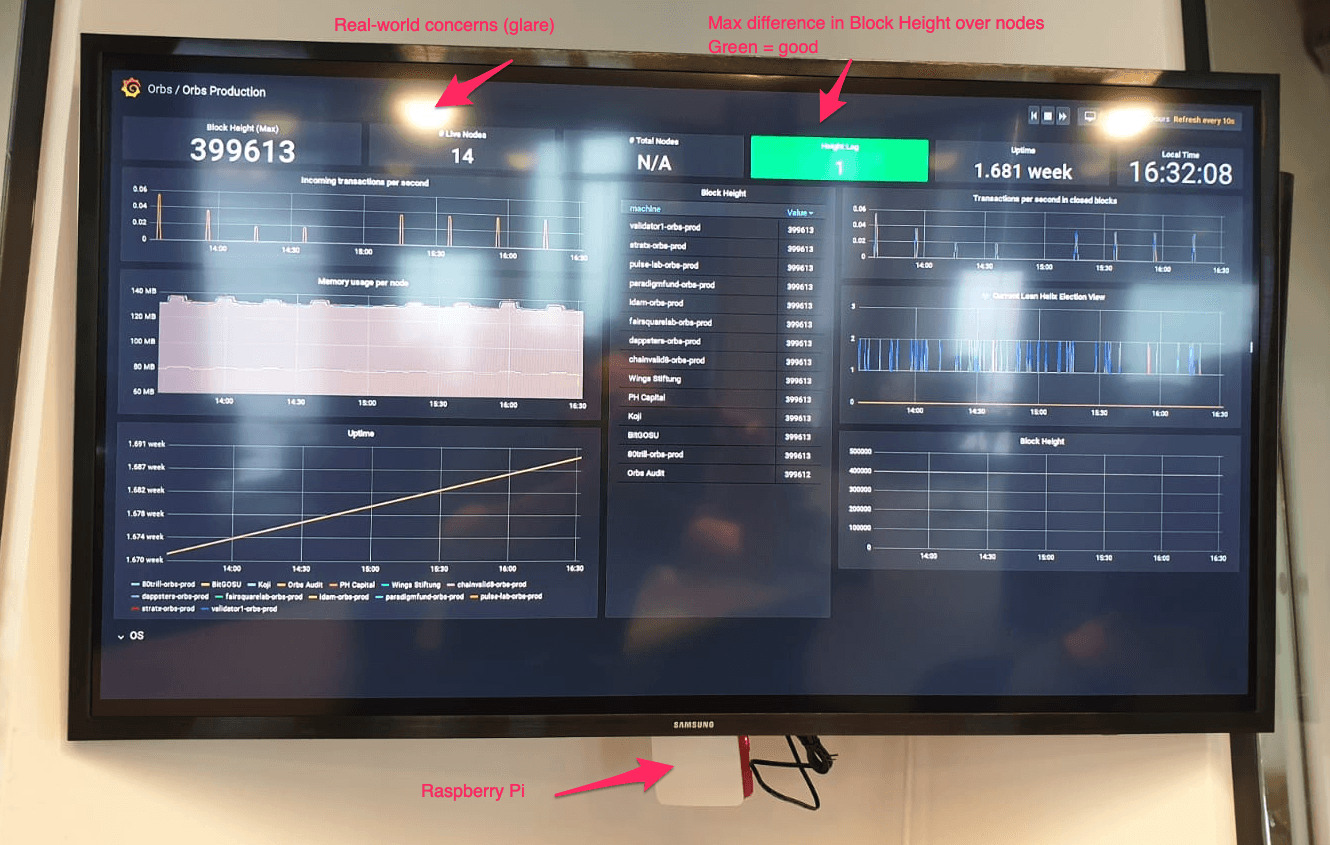
So we decided to go with a Raspberry PI B+ v3 which is a mean little machine, capable of rendering the graphs without a hitch. Since it's a Linux machine and has wide community around it, it was easy to find solutions and guides on how to set up Grafana to our liking.
Here is our real monitoring TV (complete with window-glare):
Let's go over the monitoring architecture we eventually came up with:
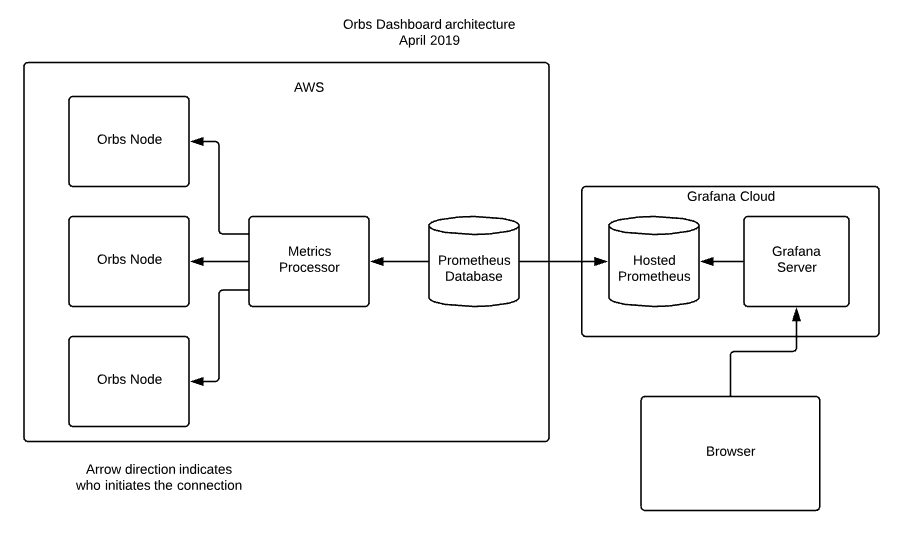
In our test networks, the Orbs Nodes are our own machines on AWS. On Production, they are managed by their respective owners. Most of them are on AWS but it matters not, as long as their /metrics endpoint is accessible.
The metrics processor is a Node.js server running on an AWS machine. It passively listens on requests on its own /metrics endpoint and when called, executes HTTP POST requests to /metrics of every node, collects the metrics and converts to Prometheus format and returns the data.
Conversion to Prometheus format is done with the help of a Node.js Prometheus client library.
We use pm2 to make sure metrics-processor stays up in the event of a machine restart. We use an ecosystem file to configure it.
We initially planned to configure the Hosted Grafana's Prometheus Database to periodically sample the metrics-processor but unfortunately it is a passive-only solution, meaning you have to push data into it rather than have it actively scrape targets (such as the metrics processor) to pull data.
The solution was to create a second Prometheus database to act as a bridge. We do not need to store data on that Prometheus - its only purpose in life is to periodically pull data from metrics-processor and push it to the Hosted Prometheus.
For the Prometheus bridge, we use a predefined Prometheus Docker image with some simple configuration. It runs on the same AWS machine as the metrics-processor and has automatic restart configured for it, so if the machine restarts, Prometheus will start automatically. So while it is a somewhat unwanted addition to the architecture, it requires very little maintenance.
The Hosted Prometheus on the Grafana Cloud is where the actual metrics data is stored, so all tests data (and now Production data) is easily presentable on Grafana.
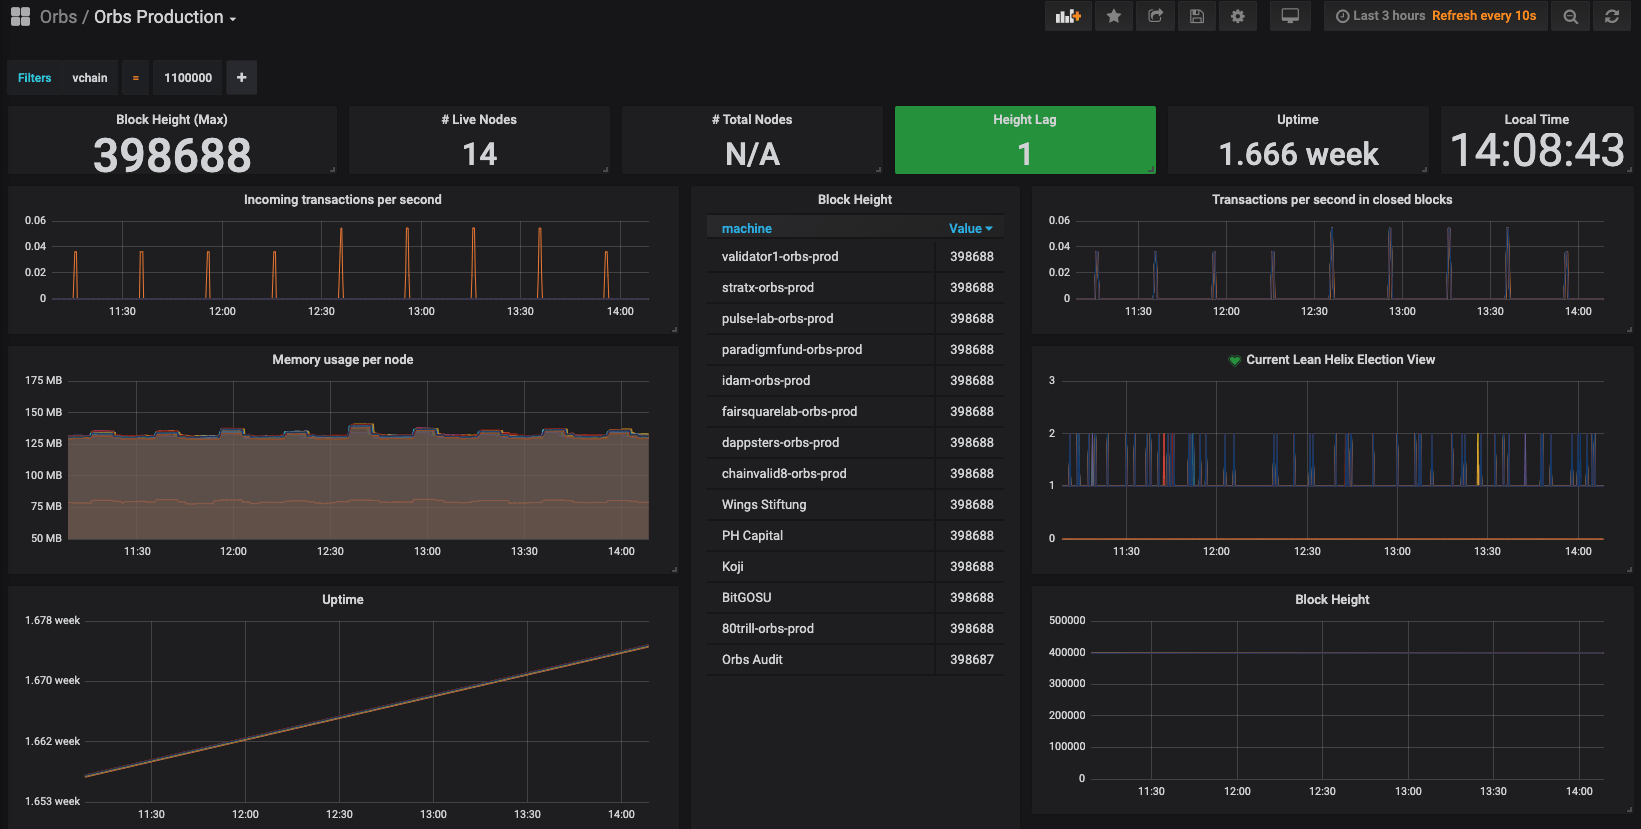
An "Orbs Production" dashboard, whose purpose is a high-level view, suitable for TV display, for casual glances once in a while to see everything "looks right".
Sample of the Orbs Production dashboard:
Sample of the Orbs DevOps dashboard:
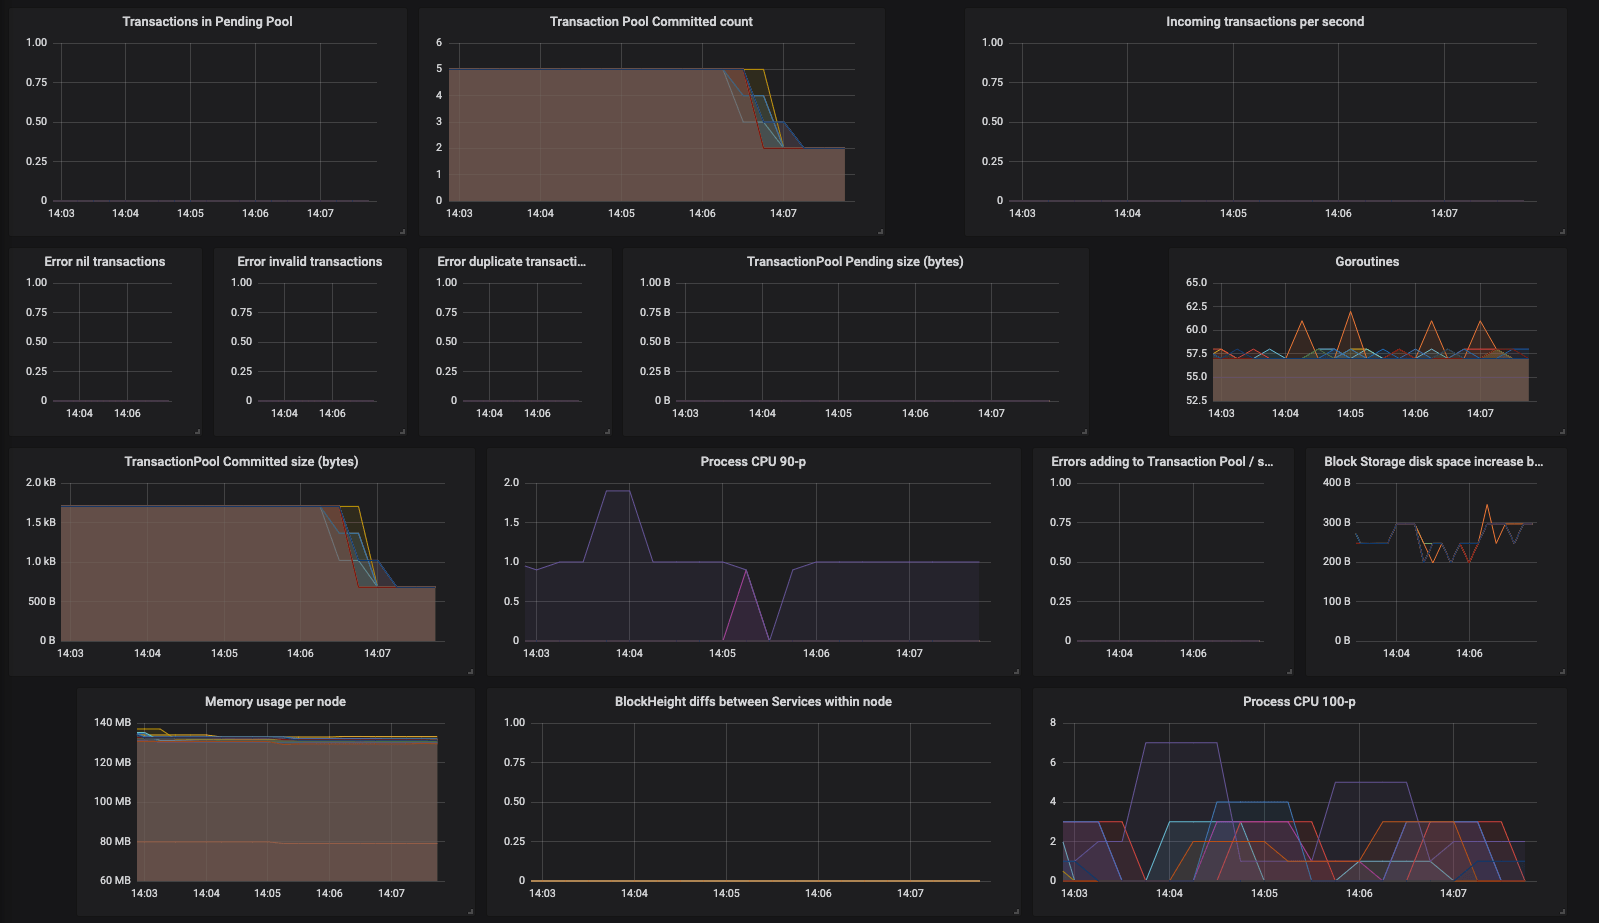
We plan to introduce a Prometheus Go client library into the Orbs node to allow it to output its metrics directly in Prometheus format in addition to the existing JSON format.
During the last month before launch, we continuously ran long-running tests ("stability tests") with the sole purpose of spotting bugs which manifest themselves only after some time the system has been running. We suspected some bugs eluded us on our otherwise very well tested code - we have a suite of unit, component and integration tests and the whole system was written with strict adherence to TDD principles.
Typical stability configuration was a 22-node network (our expected max nodes in Production) with about 10 transactions per second (tps) using the Lean Helix consensus algorithm and the proposed Production configuration. We did not try to optimize performance, nor hit resource bounds - only detect anomalies resulting from prolonged runtime. We did discover and fix a memory leak due to some goroutines not terminating, which could not have been otherwise detected.
The method of testing was to let the test run, track it with the dashboards described above, and if some anomaly came up, enable logs on one or more machines and investigate using logz.io. Error logs are written to logz.io by default but the Info logs are not, as they are very verbose.
Logz.io takes a log line and extracts properties in addition to the basic message. This lets you filter over properties, for example show messages only from node "fca820", or messages for block-height 1 and so forth. When debugging a flow of activity, enabling various filters on properties such as those is essential for making sense of the large amount of logs generated.
Here is a sample log line with properties:

The purpose of load testing is to identify load limitations of specific network configuration. This takes place after stability tests are completed. The monitoring of load tests is identical to that described above. Our Load Generator is a Go process that uses the Orbs Client SDK in Go to generate the load.
The load generator process sends out transactions at some rate (transactions per second - tps), split evenly between all machine. Its present implementation is to send out a burst of n tps, then sleep for a second, then repeat. This is not exactly how sending at specific tps should work, and we plan to improve on this implementation.
We tested on 3 different network configurations:
4-node network on the same AWS region (m4.xlarge in us-east-2)
8-node network on the same AWS region (m4.xlarge in us-east-2 and us-east-1). Same as #1, only more nodes.
15-node network - actual production nodes (m4.xlarge, multi-region)
These are the actual production machines, operated by the Validators. The test ran on a separate virtual chain than the production virtual chain. This means it ran on the same AWS EC2 machines as Production, but on different Docker containers (each virtual chain runs on its own Docker container) so the Production virtual chain is not polluted with load test inputs.
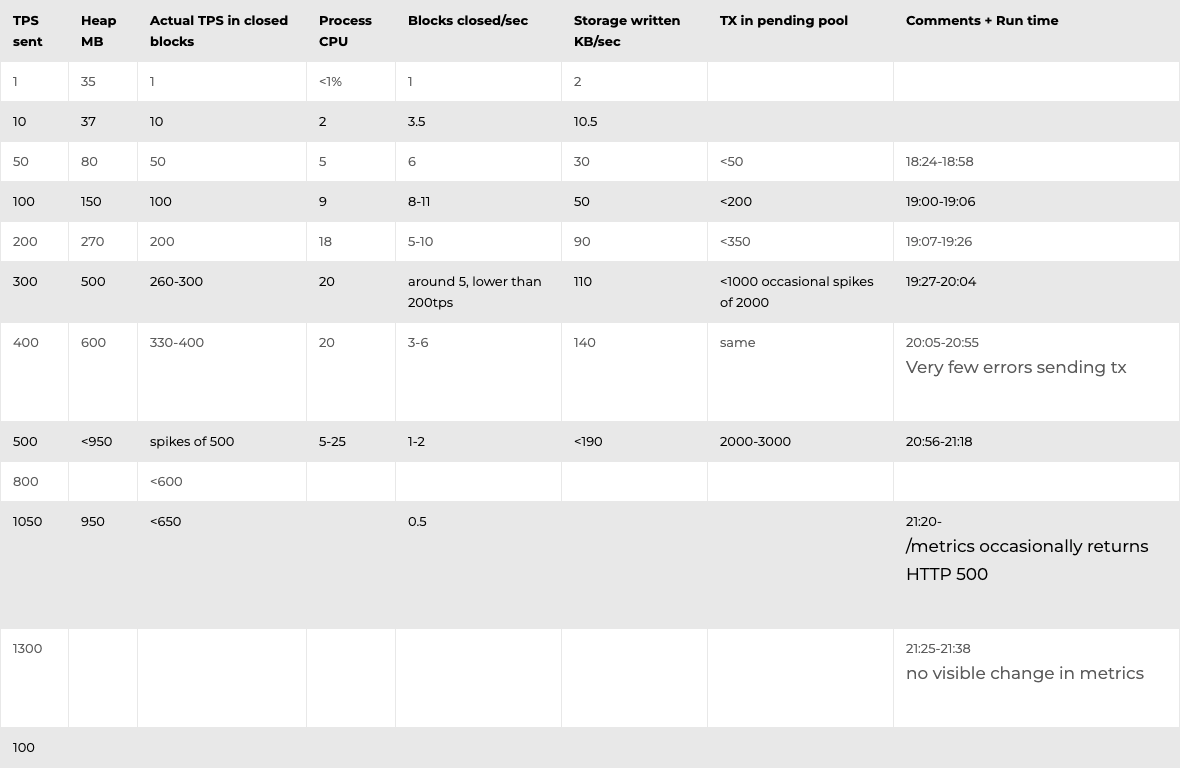
The detailed results can be found below. Based on the results, we have concluded the following:
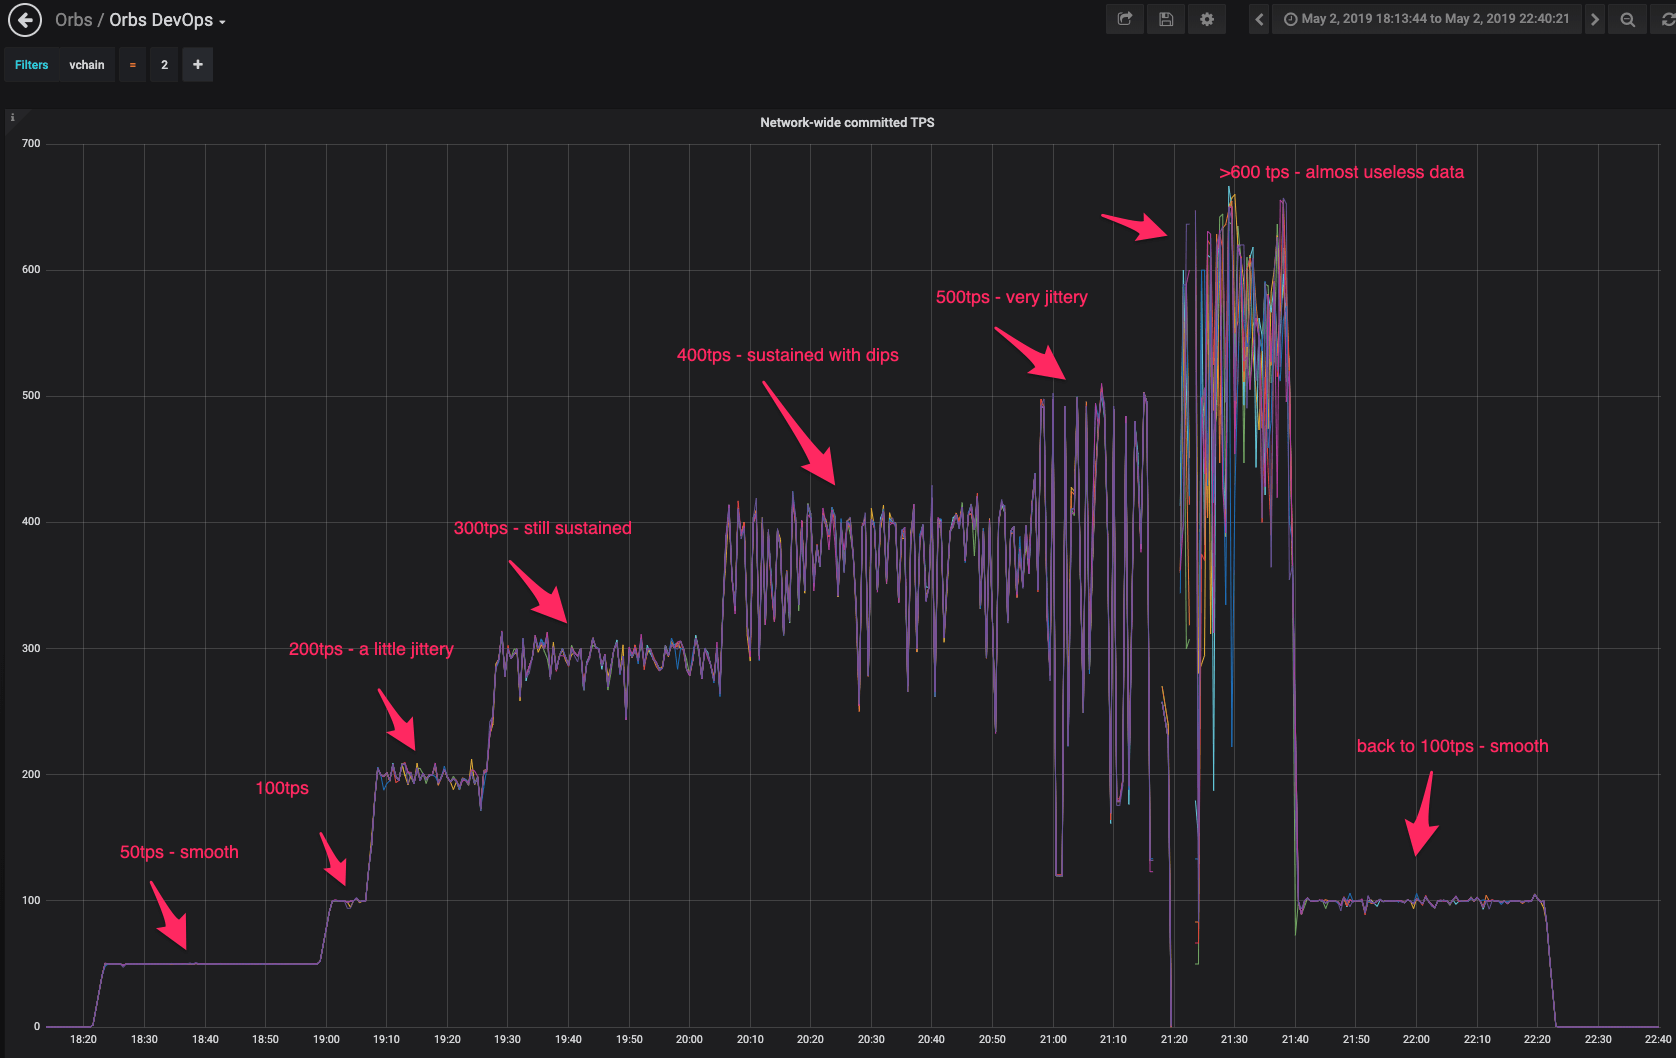
Detailed results (posted here as raw data from a single load test, take with a grain of salt):
4-Node Network

8-Node Network
···
Going forward, we plan to integrate Prometheus metrics right from the node itself, thereby omitting the JSON to Prometheus conversion, and allowing us to generate histograms right in the node itself.
We use cookies to ensure that we give you the best experience on our website. By continuing to use our site, you accept our cookie policy.