


Target audience:
Validator DevOps, Orbs contributors and anyone interested in log analysis of the Orbs platform
···
As new software meets the real world in production for the first time, unforeseen issues pop up. Anyone in the business long enough knows this for a fact.
Orbs platform is no different, and while considerable effort was, and still is being expended to retain the highest code quality, post-production incidents do happen, but they provide opportunities to make the software better yet.
Part of improving software and keep learning from experience is creating case studies such as this one.
This post includes technical notes to help you, the reader, make sense of the information you are seeing. It is not an exhaustive description of Lean Helix or any other service of the Orbs platform. For that, visit the Orbs Spec.
Such was the case that a few weeks post-launch, the Orbs core team observed less than optimal behavior of the Lean Helix consensus algorithm in production. The dashboard showed that frequently, a block passes consensus only on the third attempt, instead of the expected first or second attempt. This meant it took longer to reach consensus and consequently transaction requests took longer to return a result to the caller.
Technical note:
Before going into more detail, let’s understand a bit how Lean Helix works (with gross oversimplification):
The above flow is called a View. The first iteration (view) is denoted V=0, the following iteration (with a new leader) is V=1 and so on. The time limit per View is exponentially increased for every View. For V=0 the leader has 4 seconds to reach consensus (production configuration as of May 2019) before it is replaced. For V=1 the next leader has 8 seconds, for V=2 the next leader has 16 seconds and so on.
When consensus on a block is reached, every node commits the proposed (now accepted) block, the View is reset to V=0 and the process repeats itself.
Read more about Lean Helix: Orbs’ Unified Theory of Randomness: Explaining the Helix Consensus Algorithm
Now, given the production configuration, it was expected that the first leader at V=0 will sometimes be able to reach consensus, but mostly the second leader at V=1 will do that (exactly why is out of scope). There was no apparent reason to reach the third leader at V=2 unless there was some considerable network lag.
Having said all that, here you can see the problem:
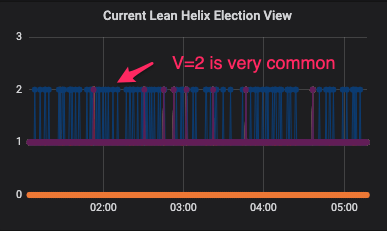
Instead of having all nodes report they are either on V=0 or V=1, the frequency of V=2 was quite high.
So, we started digging deeper.
It was clear that a specific node (let's call it Node A, its actual identity is irrelevant to this case study) as exhibiting the majority of V=2 incidents.
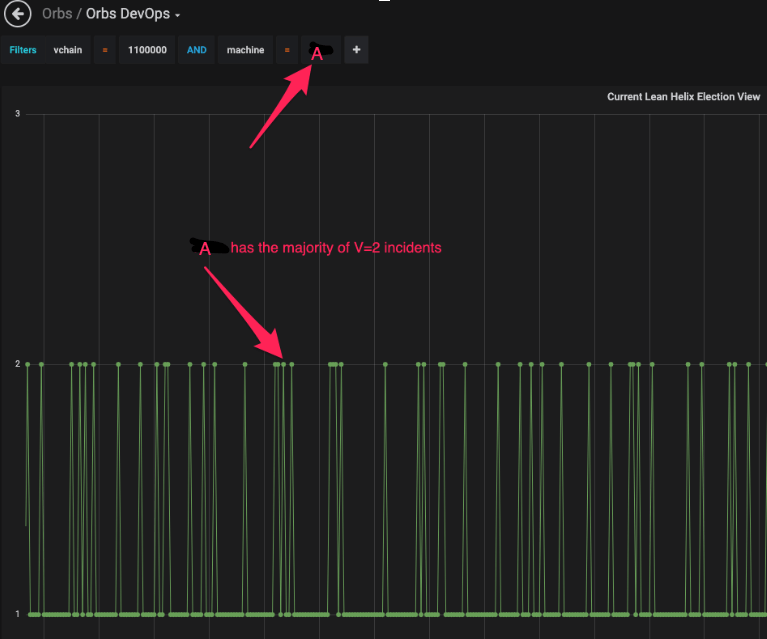
At this point, the dashboard could not provide further clues. Suffice to say that one of the Orbs core team's monitoring goals is to improve on what can be easily identified in the context of the dashboard and postpone the following costly log research to more complex issues.
In this case, logs were the next step.
From a troubleshooting perspective, we were fortunate to have frequent V=2 incidents so it was easy to obtain fresh logs around the timeframe of such incidents. It can be quite frustrating trying to debug a rare issue for which logs are not readily available.
The logs use the node's Orbs address for filtering. In node A's case, it is "0123456789abcdef", sometimes contracted to "012345".
Since we did see Node A's block height advancing we knew it was up to date on the blocks.
Now, when a node does not commit a block through the consensus algorithm, it can still receive new blocks via Block Sync.
Technical note:
Block Sync is a service within the node that wakes up after some predetermined time during which no new block was committed. The node assumes that it's being left behind for whatever reason, so it requests newer blocks from other nodes in the network. This is useful in case the node was down for a while and now needs to sync to the rest of the network. It is also useful in this case, where blocks are not being committed as part of the consensus algorithm.
Read more about Block Sync in Orbs Spec: Block Sync in Orbs Spec
We suspected that node A was advancing through Block Sync rather than through consensus.
So, the initial filter was to show blocks being committed as part of the consensus algorithm flow.
Analyzing logs is like looking at the data with various lenses, one at a time, each of which captures only a subset. For logs over some size, there is simply too much data for a human to grasp in one go.
So, here is the first screenshot from logz.io. In it you can see positive filters (in blue), negative filters (in red) and a search string (logz.io uses the Lucene query format).
The PHASE COMMITTED message means the block was committed as part of the consensus algorithm.
We noticed the lack of node="012345" (a shortened version of the node address) - it's not there, nor before or after this time.
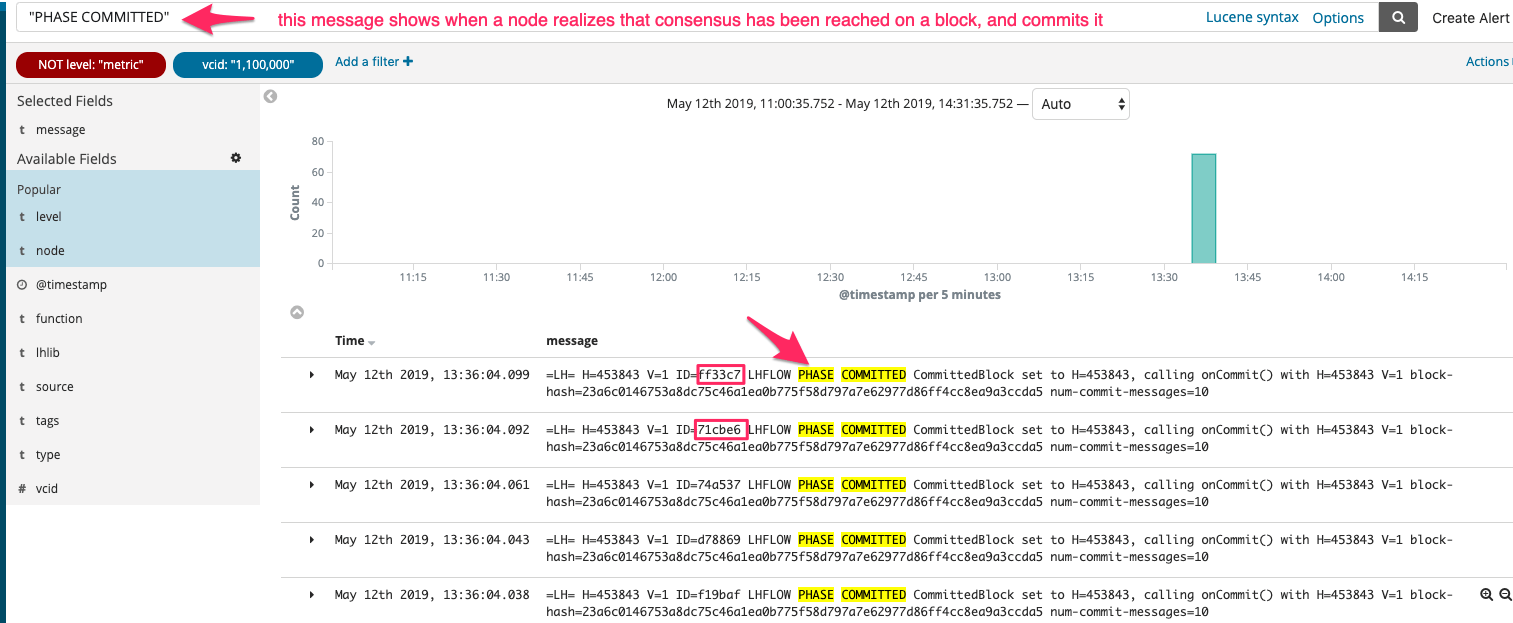
This made us assume that no blocks are committed as part of consensus at all, on node A.
To make sure this assumption is correct, another search was made.
This search confirmed that node A only receives blocks via Block Sync. It shows that every block of Node A was received via Block Sync, no exceptions: "successfully committed block received via sync":
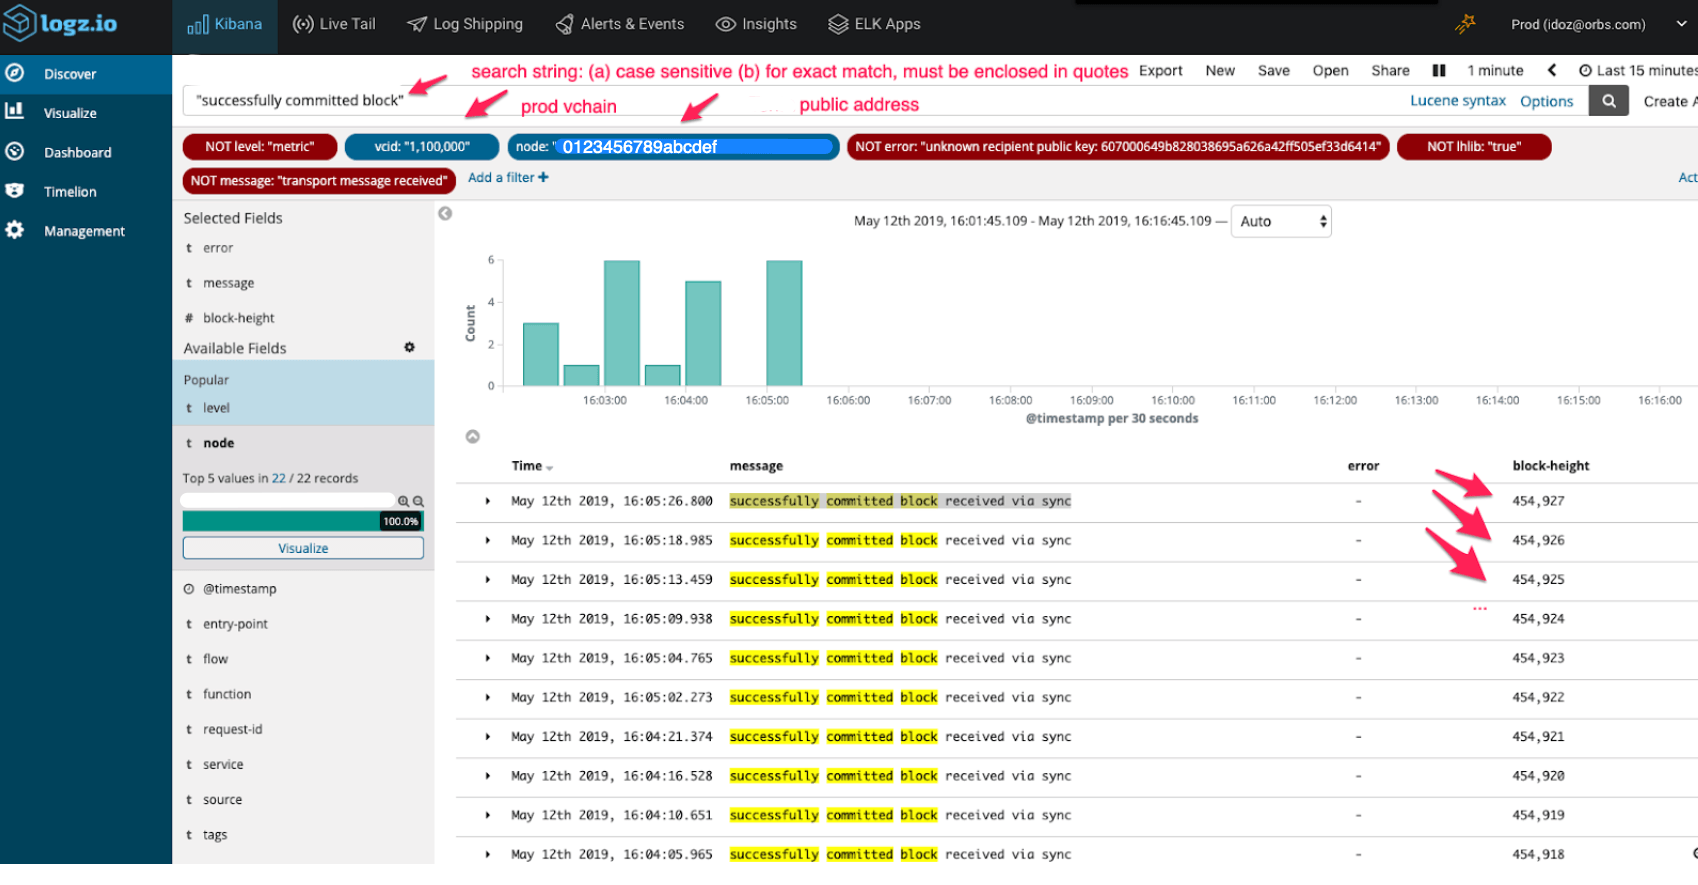
As a sanity check, we checked which additional nodes receive this message (that is, don't commit blocks through consensus algorithm). We found out that other nodes occasionally also receive blocks via Block Sync. It's ok for this to happen from time to time, but node A showed this for 100% of the blocks.
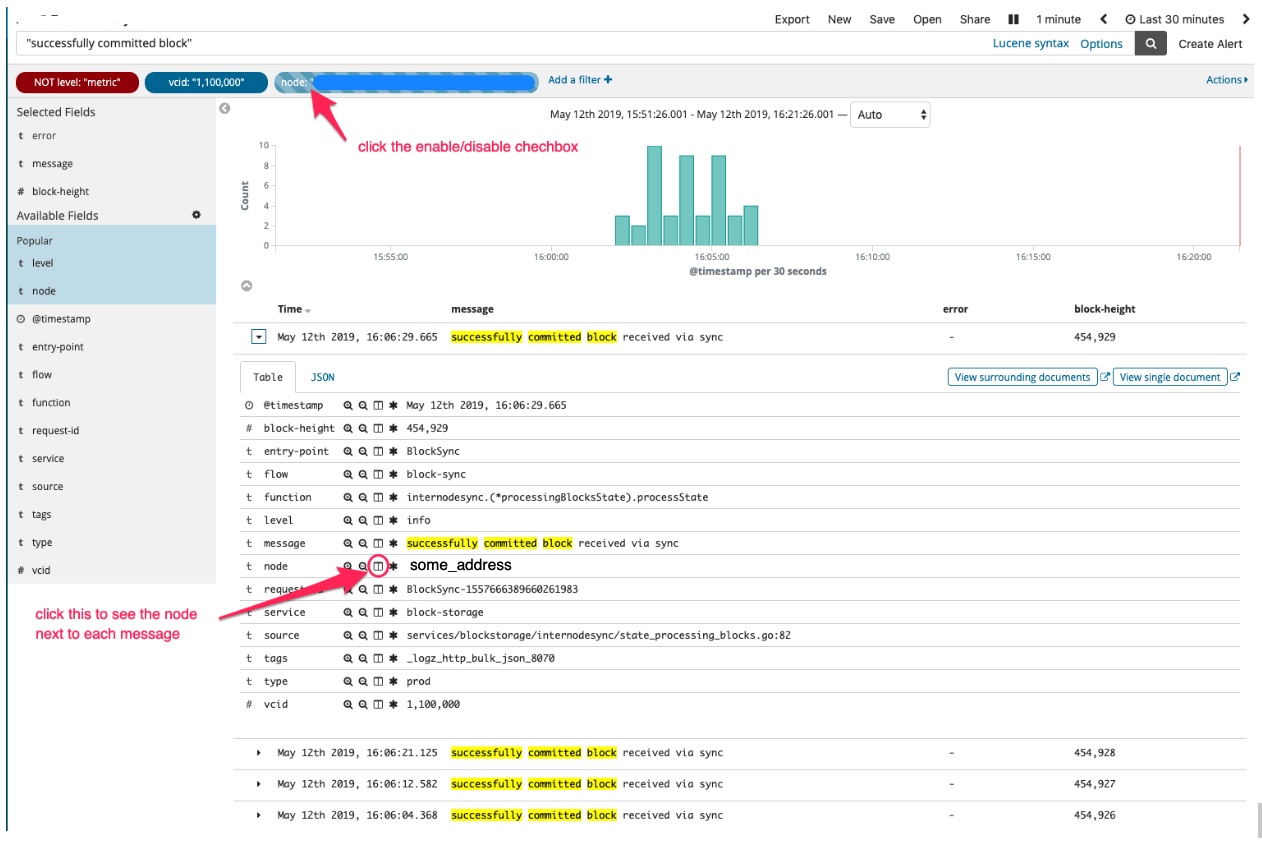
At this point, we established that Node A fails to reach consensus 100% of the time, so it was time to dig into Lean Helix consensus algorithm's logs to follow Node A's flow through it and understand what goes wrong.
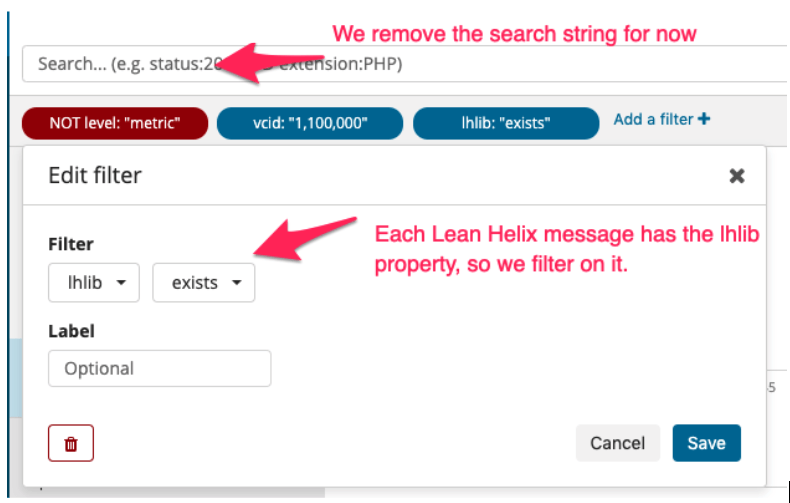
We now focus only on Lean Helix logs to narrow the investigation. All Lean Helix logs have a property called lhlib which is set to true, so it is easy to filter for only these messages by adding a condition that lhlib property exists - see below.
Let's focus on a specific block that Node A had to receive from Block Sync, but other nodes managed to commit with consensus: 454927. We obtained this block number from the screenshot with "successfully committed block via sync" messages above.
Notice the search string "H=454927" in the screenshot below:
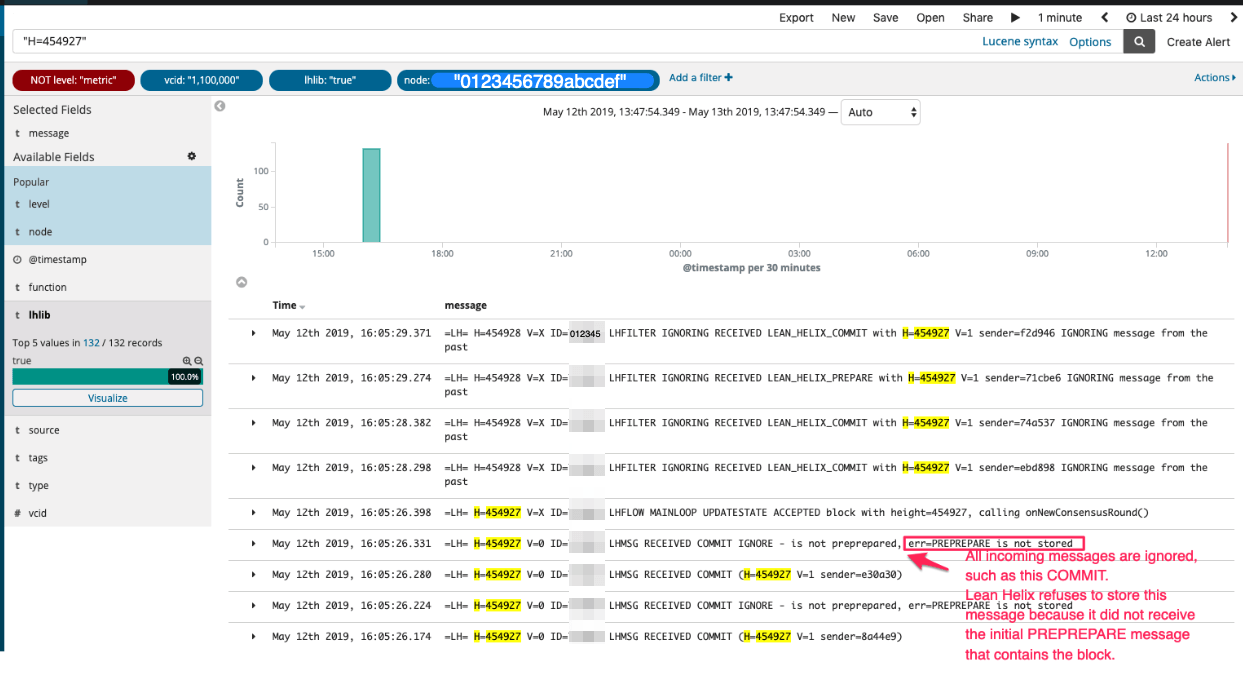
We can see that consensus messages are being ignored (such as the outlined COMMIT message in the screenshot above) by Node A, because "PREPREPARE is not stored" (same as "not received at all" for our purposes). To understand what this log message means, here is another technical note:
Technical note:
When the leader node proposes a block to the other nodes, it does so by broadcasting a PREPREPARE message that contains the block, to the other nodes. Then the other nodes "debate" with one another whether they agree on the proposed block or not, by passing around more message types, such as PREPARE and COMMIT (no need to discuss those here).
PREPREPARE is the initial message sent by the leader and contains the proposed block itself. If it was not received by some other node, that other node will refuse to receive any other subsequent consensus messages related to that block, because there is no point in participating in consensus if the node doesn't have the proposed block, to begin with.
Next, it was time to understand why PREPREPARE was not received by Node A.
Yet another technical note:
As we said, the leader of the first view (V=0) sends out a PREPREPARE message that contains the proposed block. Now, if the leader fails to reach a consensus within the time limit, it is replaced by another leader, now at V=1. Here is a twist: usually, that new leader of V=1 will utilize the same block proposed by the previous leader (cheaper than creating a new block itself). It will send the reused block to the other nodes within a NEW_VIEW message. That NEW_VIEW message contains within it the previous leader's PREPREPARE message along with the reused block (essentially the new leader says: "Hey, the last leader's proposed block was valid, we just didn't manage to agree in time so let's try again")
Next, it was time to search for where Node A actually received a PREPREPARE (if it did at all) from the leader and find out what went wrong with it. Turns out Node A did receive PREPREPARE from the leader.
Here it is, let's break this screenshot down:

At 16:05:23.988, a NEW_VIEW message is received by Node A from the leader of V=1 (sender="ff33c7"). As explained in the last technical note, this is expected. The next thing that should happen is for Node A to unpack the internal PREPREPARE message, and from it, to unpack the block and validate it.
NEW_VIEW was unpacked and its contained PREPREPARE was also unpacked (it's just not logged), however the attempt to validate the contained block fails, due to the block's timestamp. This is weird! no other node failed to validate this block.
Let's understand the outlined error message:
currentTimestamp=159df14e0fab5b36 translates to May 12 2019 13:06:03 (with the help of a hex → decimal calculator and this site that converts millis since Epoch to ISO8601 time string). prevTimestamp=159df14bde5aed90 translates to May 12 2019 13:05:54. So far so good - the current block's timestamp is later than the previous block's timestamp, which makes sense.
Next, we see: now 2019-05-12 13:05:23.989402103.
This does not make sense! how can "now" on the machine be earlier by 40 seconds than the current block's time? later on that line, you can see the tolerance between "now" and the block's timestamp is 30 seconds (jitter 30s) and because the difference is larger (40s), validation fails, and all of the above results from it.
Note: This error message is admittedly confusing and has already been made by human-readable as a result of this investigation.
At this point we were nearly convinced this is a machine clock error on Node A as this code works correctly on all other nodes.
After contacting node A's IT, they indeed identified a 29 second time drift on the machine's clock, and promptly fixed it.
A few minutes after they fixed the machine's clock time, we took these screenshots:
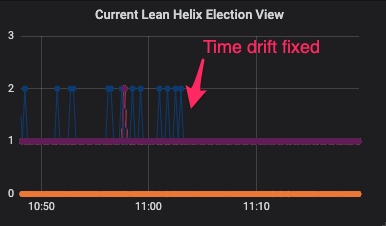
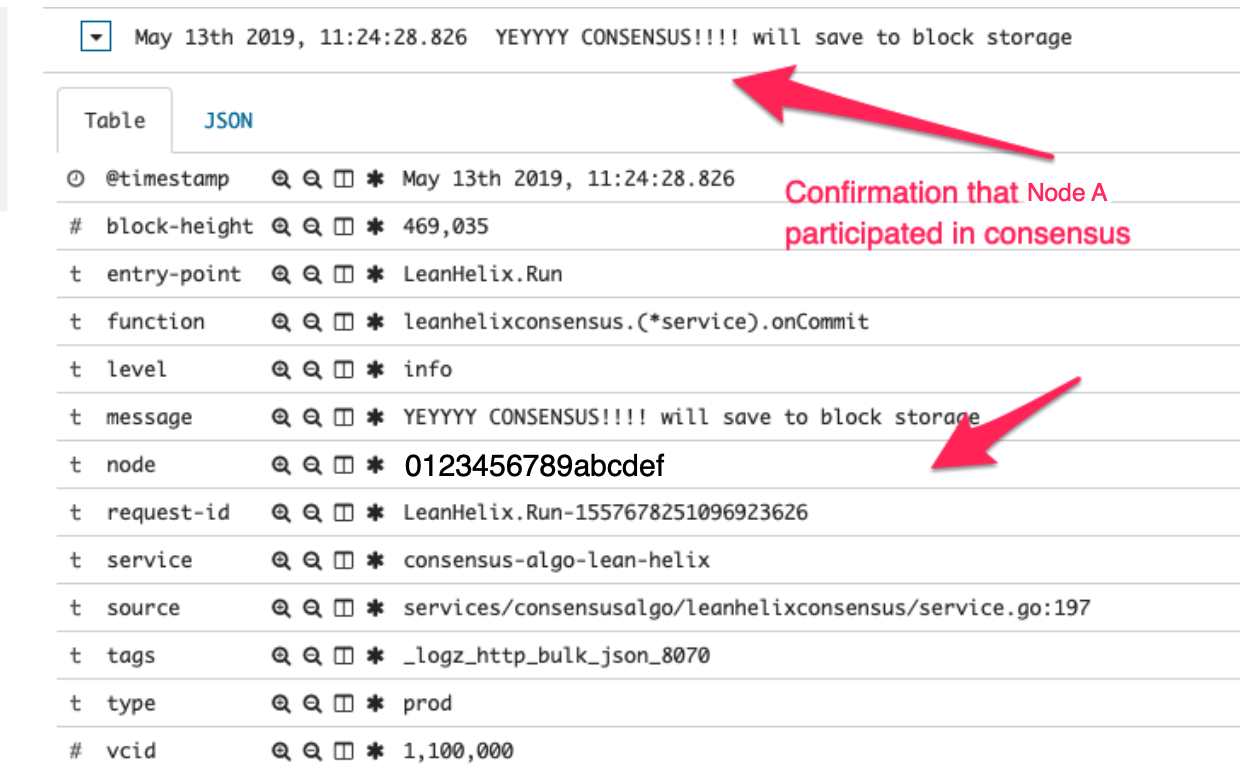
The above screenshot shows the V=2 symptom is gone. To be on the safe side, the screenshot below shows Node A managed to participate in consensus and commit a block, thus no longer relying on Block Sync.
···
The purpose of this post was to shed some light on the troubleshooting Orbs platform issues along with technical notes on some internal workings.
Obviously having detailed knowledge of the system makes this process easier, but reading dashboard graphs and filtering through logs is a generally useful skill that can be applied to any monitored system.
We use cookies to ensure that we give you the best experience on our website. By continuing to use our site, you accept our cookie policy.